Or Reactive Power to full?
I made a claim about the power consumption of my EL panel earlier that was patently false for a very interesting reason.
Background
So it should be obvious by now that if I open my mouth and say anything about electroluminescent materials, it’s probably wrong. In this case, it has to do with my estimations that I made in this post where I was trying to figure out how much power my EL panel draws from my store-bought EL inverter. I measured 50mA of current draw at 120V from the panel which worked out to a six watt load! That’s a huge amount of power to be delivered to a handheld device.
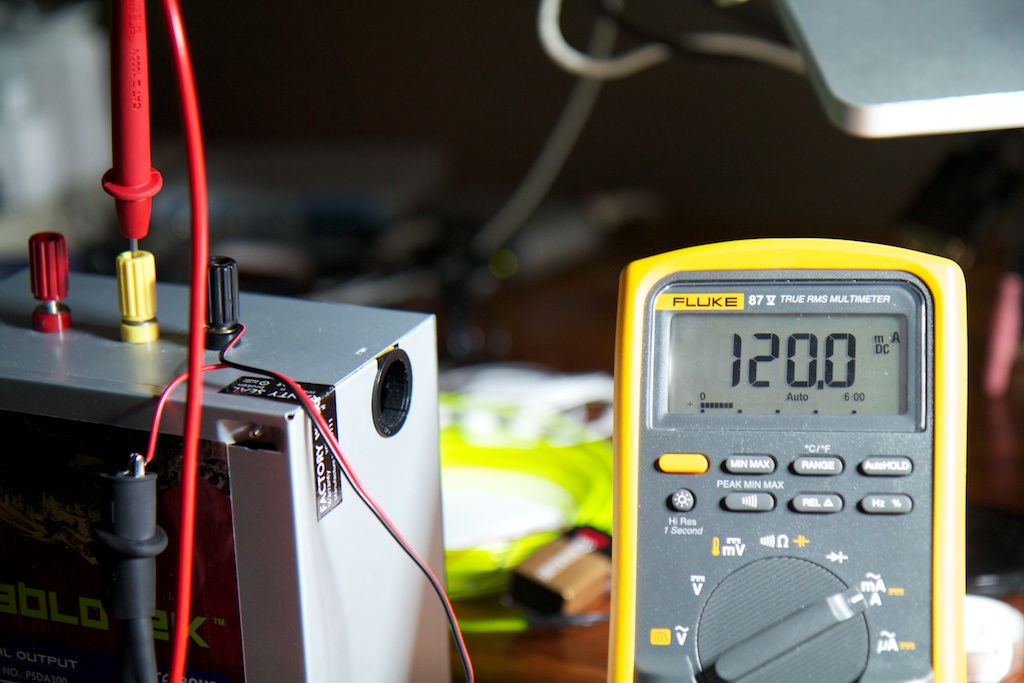
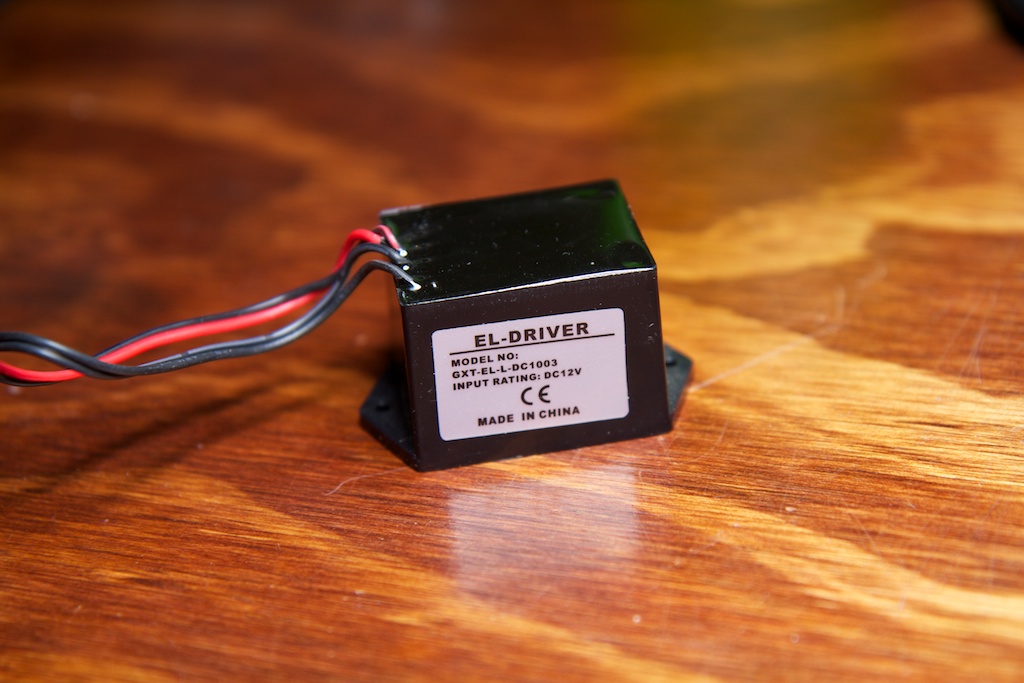
Later that week, skeptical of my measurements, I decided to measure it again, but instead of measuring the 120V AC current coming from my inverter, I measured the 12V DC current going to my inverter. I found this:
So let’s work out the power being drawn by the inverter:
![]()
![]()
So wait a second, I’m getting six watts out of my inverter but only putting 1.44W in? I’m getting out more than I’m putting in! I’VE SOLVED THE ENERGY CRISIS EVERYONE YOU CAN RELAX NOW!
OUR SAVIOR
In all seriousness though, there is a very interesting explanation for what I saw.
Reactive Power
When we calculate power draw, we usually do so by multiplying current and voltage. This is the standard
![]()
formula that you’ve seen hundreds of times. It’s not exactly right though or at least you have to be a little more specific.
The important thing to note is that you need to actually measure the instantaneous voltage and current, calculate the instantaneous power, and then integrate the instantaneous power over time to get the average power draw. When dealing with DC currents and voltages, the instantaneous current and voltage are going to be pretty close to the average.
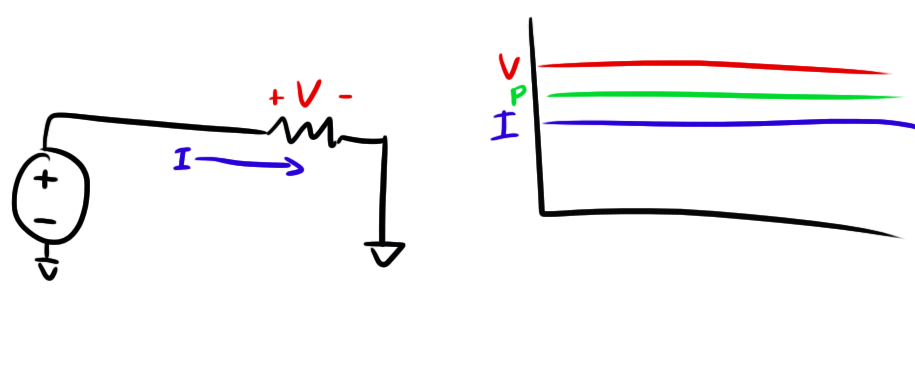
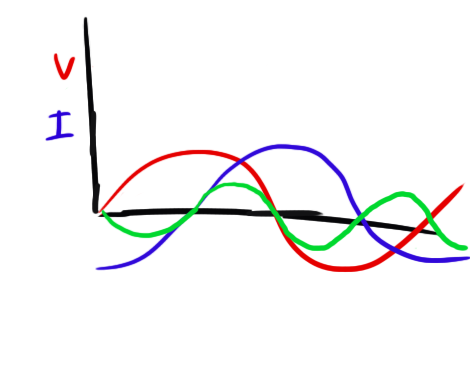
Here’s a simple case of a voltage supply driving a resistor. Measuring the voltage across the resistor and multiplying it by the current will give you the instantaneous power which is graphed to the right (note that all three lines are different units and are therefore on different scales on the Y-axis so ignore their relative amplitudes; X-axis is time):
If you want to measure the average power delivered to the resistor, you can just take the area under the green curve (units:
![]()
) and divide it by time. Now this is a little overkill. Instead of taking the integral of the instantaneous power draw over time, you can just take the instantaneous current and multiply it by the instantaneous voltage to get the same result.
Let’s look at another case though. Here we have a current source driving a capacitor and we want to figure out the power drawn by the capacitor:
To explain what you’re seeing, just remember the formula for the charge stored in a capacitor also known as the “Home Shopping Network” formula.
![]()
Where
![]()
is charge in units of Coulombs. If we divide the whole formula by time,
![]()
becomes
![]()
(charge per second), and
![]()
becomes
![]()
. So if we have a constant current (
![]()
), the rate of change of our voltage is also constant. Thus you get a straight line.
Now the important part of this plot is to note how voltage is not constant even though current is. They are out of phase. If you were to take the instantaneous voltage measurement at some point and multiply it by the current measurement like we did with the resistor, you would not get the correct result for average power draw.
Now let’s really blow your mind.
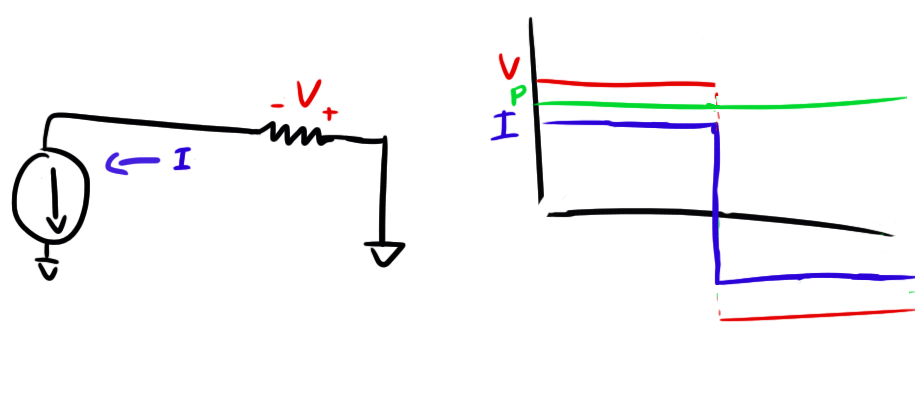
Let’s say after the capacitor reaches a certain voltage, you decide to reverse the current supply and drain the capacitor:
When you switch the current supply around, the instantaneous power draw goes negative and the capacitor turns from a power sink to a power source and starts feeding energy back into the current source.
The weird thing is that when you add up the area under that power curve (remembering that area below the X-axis is “negative area”), you’ll find that despite all the current and voltage moving around, the average power drawn by the capacitor is actually zero!
So Why is this Bad?
You might be thinking after seeing the above “of course the average power is zero, the average current is zero and
![]()
!” Remember that the average current and voltage in every AC circuit is always zero. That’s why we don’t measure average voltage or average current. We use RMS voltage and current.
If you don’t know what RMS is, I recommend reading my blog post on the matter. Basically, RMS is a way of measuring AC voltage and current that makes it easy to do power measurements. If you place an AC power supply across a resistor and multiply the RMS voltage across that resistor by the RMS current, you’ll get the power drawn by the resistor.
Unfortunately, this trick only works when your load is a resistor and your voltage and current always have the same sign. Think about that third plot above. If we were to replace that capacitor with a resistor, the power curve would never go negative. As soon as the current switches directions,
![]()
dictates that the voltage would switch sign as well:
A negative voltage times a negative current still gives you a positive power.
The relative sign of the voltage and current is what determines what kind of load you’re dealing with. Something like a resistor is called…well… a resistive load. That means that it doesn’t store any energy. A capacitor is known as a type of reactive load. That means that it can store energy and its voltage and current don’t always have the same sign. A purely resistive load keeps voltage and current in phase and dissipates energy. A purely reactive load keeps them 90
![]()
out of phase and dissipates no energy. Some loads can be partially reactive and partially resistive which do a little of both.
Special considerations have to be made when measuring the power draw of a reactive load.
So Why Am I Dumb?
I’m dumb because I made the mistake of using RMS measurements to calculate the power drawn by a partially reactive load. To see what I mean, let’s say you feed an AC signal into a capacitor. Your current/voltage waveforms will look something like this:
Remember that:
![]()
So whenever the voltage is at a peak (slope zero) the current is zero, and vice versa. Now let’s add our power trace to our plot:
Every time the voltage and current have the same sign, the power is positive and every time they have opposite signs, the power is negative. Therefore, the average power (area under the curve) is zero.
When you use RMS, you take all signage out of the equation. There is no positive or negative RMS, there’s just RMS. This removes the critical phase information and is why using it to measure power only really works for resistive loads where voltage and current are always in phase and power is always positive.
The zero-average power draw of a capacitor is actually a very real concern for large-scale energy transmission. If your load (household) is slightly reactive (resistor in series/parallel with a capacitor) so that voltage and current are slightly out of phase, you will end up drawing more current than you need to and spitting the extra back into the power grid just like how our capacitor fed energy back into the current source. This means that the power grid needs to be capable of handling large current draws (thick enough wires, etc) just to support delivering more current to you than you end up actually using. We call the power that a load dissipates the “real power” while the amount that it spits back into the grid the “reactive power”. Real power is useful and can do work, reactive power cannot.
Ideally all loads would be purely resistive so that the utility company could use the lowest capacity (and therefore cheapest) methods of delivering current to customers. As it is, they put regulations on what is called “Power Factor” which is basically just a way to measure how reactive your household is. If your power factor drops below a certain point (too reactive), you might be charged a higher rate.
So How Should I Have Done It?
What I was actually measuring in my circuit was not the real power but rather the “apparent power” which is a combination of real and reactive powers. Apparent power is what you get when you multiply RMS voltage by RMS current. Because apparent power doesn’t necessarily dissipate energy, it is measured in Volt-Amperes instead of Watts. The two units have the same dimensions, but they are interpreted differently.
The three types of power can be drawn like this:
Where
![]()
is the phase angle between voltage and current. This makes sense when you think about it: If
![]()
=0, the apparent power equals the real power. This is the case with purely resistive loads where current and voltage are in phase and multiplying the RMS current and RMS voltage is still a valid way to determine real power. Likewise, if
![]()
=90
![]()
(like in my AC signal above), the load is purely reactive and the real power drops to zero.
Since I already have the apparent power (6VA), all I need to determine the real power is the phase angle between current and voltage. That should be pretty easy to measure!
To take this measurement, I put a 10
![]()
resistor in series with the EL panel. The voltage drop across this resistor gave me the current. I also put a resistor divider across both terminals of the EL panel to measure voltage. This was a 1:100 divider and was needed to drop the 120V output to something more safe for my oscilloscope.
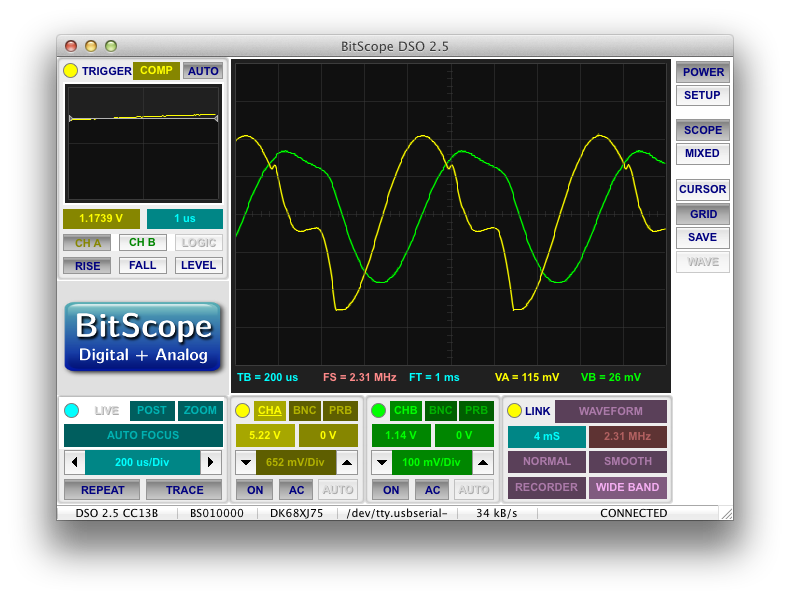
The results looked like this:
Where voltage is yellow and current is green. Just as expected, the voltage and current waveforms are not in phase. How far out of phase are they? I measured the time lag between the zero crossings as approximately 188
![]()
s while the period of the waveform was approximately 816
![]()
s.
To get the phase difference, we can just take the phase lag ratio and multiply it by 2
![]()
.
![]()
So I have a phase lag of 1.44 radians. Using the right-triangle drawn above, the real power can be found using basic trigonometry:
![]()
![]()
So there you have it folks. My power supply takes in about 1.44W and outputs around .79W to the EL panel.
Now I admit that the voltage and current waveforms were not exact sinusoids, so this number isn’t 100% accurate. To get a better answer, I would have to calculate the instantaneous power at every point in the cycle and then integrate it over the period. I’m too lazy for that though, so as long as my result says that I’m not putting out more power than I’m taking in, I’m satisfied.
Conclusion
So my power supply went from 400% efficient to about 56% efficient. It’s not impossibly good, but it’s not that bad either.
This was a pretty fun and practical refresher on reactive power. It’s something that I’ve known about forever, but never had to deal with in real life so I wasn’t thinking about it when it popped up in front of me. Next time, I’ll be more cautious before using RMS to calculate power draw.
Continue the story here.





Pingback: I Should Give China More Credit | ch00ftech Industries
Very good explanation!!! Thanks for posting.
“I’VE SOLVED THE ENERGY CRISIS EVERYONE YOU CAN RELAX NOW!”
I laughed so hard when I read this! (By the way: conservation of energy FTW)
Excellent article, once again. Your blog really is a treasure trove of well written electronics articles. Coincidentally I was trying to explain this concept to some friends in the pub a few weeks ago, i think your post is probably a lot more understandable than my half-arsed attempt was 🙂
Pingback: Sound Reactive EL Panel Dimmer (for real this time) | ch00ftech Industries
Pingback: How Much Power Does an EL Panel Need? | ch00ftech Industries